New Course - Not Enough Reviews Yet
What's Included?
- Language : English
- Level : Expert
- Duration : 5.0 Hrs
- Type : Instructor-led
- Releases :
- Category : Technology
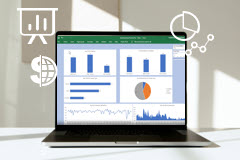
This particular course is tailored to individuals who want to master the art of storytelling using Excel Dashboards. You will explore more than 35 different formulas, create pivot tables, and use advanced formatting features. You will learn how to create a custom dashboard to present your data clearly, understand if your targeted audience would find a table or a chart more valuable, and feel confident using Excel to tackle even the most complex business problems. By the end of the course, you will complete tasks required in your workplace, and have the ability to present data in a meaningful way.
We offer thousands of SAP courses and real-world SAP sandboxes for individuals and corporate teams.
